Pythonで潮汐力のピーク(極大・極小値)を見つけてみる
先日、Pythonで満潮や干潮の原因である潮汐力(起潮力)を求めてみましたが
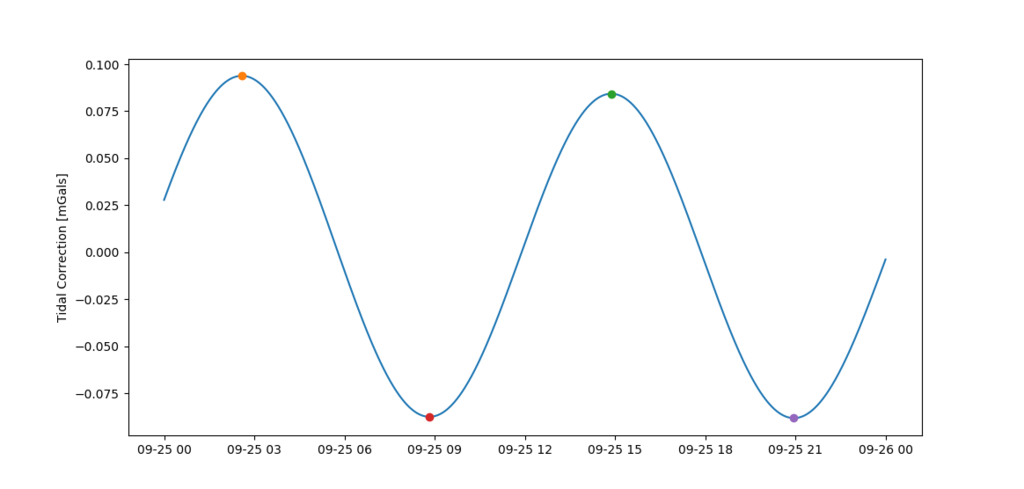
求めた潮汐力の数値データの配列から、潮汐力のピークを見つけようとすると結構面倒だったので、Pythonの数値解析ライブラリーscipyに数値列から値のピークを検出してくれるargrelmax、argrelminなるメソッドがあったので、ちょっとメモ。
scipy.signal.argrelmax — SciPy v1.1.0 Reference Guide
scipy.signal.argrelmin — SciPy v1.1.0 Reference Guide
ところで、地球は自転していますが、円周40,075 kmの球体が24時間で自転すると、赤道付近での地表面の回転速度は、秒速にして463.8m。音速よりも速いスピードで潮汐力の変動の連鎖が地球表面上を伝播し続けていると考えると、結構な衝撃かもしれませんね。
from datetime import datetime
from tidegravity import solve_point_corr
lat = 35.689556
lon = 139.691722
alt = 0
t0 = datetime(2018, 9, 25, 0, 0, 0)
result_df = solve_point_corr(lat, lon, alt, t0, n=60*60*24, increment='S')
result_df
g0=result_df.g0
gx=g0.index


from scipy.signal import argrelmax
from scipy.signal import argrelmin
import numpy as np

from matplotlib import pyplot as plt
corrections = g0
x=result_df.index
X=x.values
plt.plot(X,corrections)
plt.ylabel('Tidal Correction [mGals]')
p1=argrelmax(g0.values, order=1) #最大値
p2=argrelmin(g0.values, order=1) #最小値
p=np.append(p1,p2)
for px in p:
    print(gx[px], g0[px])
    plt.plot(gx[px], g0[px], "o")

plt.show()

SciPyで見つけてきたピークは以下
2018-09-25 02:35:11 0.09385898764910472
2018-09-25 14:52:40 0.08432521012484909
2018-09-25 08:49:43 -0.08754879933767185
2018-09-25 20:57:09 -0.088238724242216