Python Basemapで利用できる無料地図タイル(背景地図)一覧
前回、Python Basemapの背景地図を緯度・経度を指定してOpenStreetMapで描画してみましたが、
実は、Python Basemapには以下のような形でArcGIS REST APIを呼び出すだけで、
    map = Basemap(epsg=3857,
            lat_ts=center_Lat, resolution='h',
            llcrnrlon=minLon, llcrnrlat=minLat,
            urcrnrlon=maxLon, urcrnrlat=maxLat)


    map.arcgisimage(service='Ocean_Basemap',verbose=True,dpi=96, xpixels=1200)
簡単にArcGISの背景地図を描画するためのAPIが用意されているのですが、
NatGeo_World_Map(ArcGIS)

World_Imagery(ArcGIS)

World_Physical_Map(ArcGIS)

World_Shaded_Relief(ArcGIS)

World_Street_Map(ArcGIS)
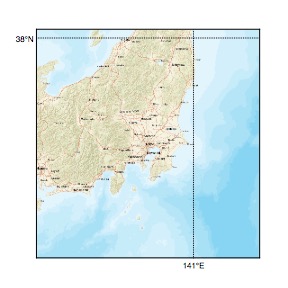
Ocean_Basemap(ArcGIS)

今回は、OpenStreetMapをはじめ、Wikimedia Maps、国土地理院などの無料で利用できる地図タイルの一覧を集めてみました。なお、使用規定などは各タイルで異なりますので、実際の使用の際にはそれぞれのサービス先でご確認ください。
タイル名:OpenStreetMap's Standard tile layer
https://a.tile.openstreetmap.org/{z}/{x}/{y}.png
https://b.tile.openstreetmap.org/{z}/{x}/{y}.png
https://c.tile.openstreetmap.org/{z}/{x}/{y}.png

タイル名:Wikimedia Maps
https://maps.wikimedia.org/osm-intl/{z}/{x}/{y}.png
タイル名:OpenCycleMap
https://tile.thunderforest.com/cycle/{z}/{x}/{y}.png

タイル名:Transport
https://tile.thunderforest.com/transport/{z}/{x}/{y}.png

タイル名:Landscape
https://tile.thunderforest.com/landscape/{z}/{x}/{y}.png
タイル名:Outdoors
https://tile.thunderforest.com/outdoors/{z}/{x}/{y}.png

タイル名:Transport Dark
https://tile.thunderforest.com/transport-dark/{z}/{x}/{y}.png

タイル名:SpinalMap
https://tile.thunderforest.com/spinal-map/{z}/{x}/{y}.png

タイル名:Pioneer
https://tile.thunderforest.com/pioneer/{z}/{x}/{y}.png

タイル名:Mobile Atlas
https://tile.thunderforest.com/mobile-atlas/{z}/{x}/{y}.png

タイル名:Neighbourhood
https://tile.thunderforest.com/mobile-atlas/{z}/{x}/{y}.png

タイル名:Humanitarian map style
http://a.tile.openstreetmap.fr/hot/{z}/{x}/{y}.png
タイル名:Toner
http://a.tile.stamen.com/toner/{z}/{x}/{y}.png

タイル名:Terrain
http://a.tile.stamen.com/terrain/{z}/{x}/{y}.jpg

タイル名:Watercolor
http://a.tile.stamen.com/terrain/{z}/{x}/{y}.jpg

タイル名:Transport map
http://www.openptmap.org/tiles/{z}/{x}/{y}.png

以下国土地理院
タイル名:電子国土基本図
https://cyberjapandata.gsi.go.jp/xyz/std/{z}/{x}/{y}.png

タイル名:土地利用図
https://cyberjapandata.gsi.go.jp/xyz/lum200k/{z}/{x}/{y}.png

タイル名:全国最新写真(シームレス)
https://cyberjapandata.gsi.go.jp/xyz/seamlessphoto/{z}/{x}/{y}.jpg

タイル名:色別標高図
https://cyberjapandata.gsi.go.jp/xyz/relief/{z}/{x}/{y}.png

タイル名:陰影起伏図
https://cyberjapandata.gsi.go.jp/xyz/hillshademap/{z}/{x}/{y}.png

タイル名:傾斜量図
https://cyberjapandata.gsi.go.jp/xyz/slopemap/{z}/{x}/{y}.png

などなど、国土地理院には他にも様々な地図タイルが存在するほか
他にも探せばまだまだ色々ありそうですね。
上のサンプル地図を描いた際のソースは以下
import requests
from StringIO import StringIO
import string
import pandas as pd
import numpy as np
import hjson

import matplotlib.pyplot as plt
import matplotlib.colors as colors
from matplotlib import cm

from scipy import misc

from mpl_toolkits.basemap import Basemap
from osgeo import gdal

from math import pi
from math import tanh
from math import sin
from math import asin
from math import exp
from numpy import arctanh

from pyproj import Geod


# 1タイルのピクセル数
pix = 256

# 描画に使用する縦横の最小タイル数
Tiles = 2

g = Geod(ellps='WGS84')


# ピクセル座標を経緯度に変換する
def fromPointToLatLng(pixelLat,pixelLon, z):
    L = 85.05112878
    lon = 180 * ((pixelLon / 2.0**(z+7) ) - 1)
    lat = 180/pi * (asin(tanh(-pi/2**(z+7)*pixelLat + arctanh(sin(pi/180*L)))))
    return lat, lon


# 経緯度をピクセル座標に変換する
def fromLatLngToPoint(lat,lon, z):
    L = 85.05112878
    pointX = int( (2**(z+7)) * ((lon/180) + 1) )
    pointY = int( (2**(z+7)/pi) * (-1 * arctanh(sin(lat * pi/180)) + arctanh(sin(L * pi/180))) )
    return pointX, pointY


# 経緯度をタイル座標に変換する
def fromLatLngToTile(lat,lon, z):
    pointX, pointY = fromLatLngToPoint(lat,lon, z)
    return pointX/pix, pointY/pix


# 指定経緯度範囲が異なるタイルにまたがる最小のズームレベルとそのタイル座標を返す
def getTile(Tiles, minLat, minLon, maxLat, maxLon):

    for z in range(0,20):
        tileX1, tileY1 = fromLatLngToTile(minLat, minLon, z)
        tileX2, tileY2 = fromLatLngToTile(maxLat, maxLon, z)

        if tileX2 - tileX1 >= Tiles - 1  and tileY1 - tileY2 >= Tiles - 1: break

    return z, tileX1, tileY1, tileX2, tileY2


# 地図画像データを読み込み各ピクセルをRGB値に変換した配列を返す
def load_imgColors(urlFormat, z, x1, y1, x2, y2):

    for x in range(x1, x2+1):
        for y in range(y2, y1+1):

            #地図画像データを読み込む
            url = urlFormat.format(z=z,x=x,y=y)
            print url
            response = requests.get(url)
            if response.status_code == 404:

                 #地図画像データが無い区画は白塗りにする
                 colors=np.ones((256, 256, 3), dtype=object)

            else:

                 #画像READ
                 img = misc.imread(StringIO(response.content))

            # 画像タイルを縦に連結
            if y == y2:
                 im_v = img
            else:
                 #im_v = cv2.vconcat([im_v, img])
                 #im_v = np.append(im_v,img,0)
                 im_v = np.concatenate((im_v, img), axis = 0) #縦

        # 画像タイルを横に連結
        if x == x1:
            im = im_v
        else:
            #im = cv2.hconcat([im, im_v])
            #im = np.append(im,im_v,1)
            im = np.concatenate((im,im_v), axis = 1) #横

    return im


def makeMap(tileServer, center_Lat, center_Lon, minLat, minLon, maxLat, maxLon):

    # 指定経緯度範囲の最適ズームとタイル座標範囲を求める
    z, x1, y1, x2, y2  = getTile(Tiles, minLat, minLon, maxLat, maxLon)

    # タイルURL
    f=open('tiles.hjson')
    tiles = hjson.load(f)
    f.close()


    # OpenStreetMapのタイル画像のURLフォーマット
    urlFormat = tiles['tiles'][tileServer]
    print urlFormat

    # OpenStreetMapのタイル画像を読み込み連結して1枚の画像として返す
    imgColors = load_imgColors(urlFormat, z, x1, y1, x2, y2)


    # 指定経緯度のピクセル座標を求める
    pointX1, pointY1 = fromLatLngToPoint(minLat, minLon, z)
    pointX2, pointY2 = fromLatLngToPoint(maxLat, maxLon, z)


    # 経緯度範囲に地図タイルをカット
    imgColors = imgColors[pointY2-y2*pix:pointY2-y2*pix+pointY1-pointY2, pointX1-x1*pix:pointX1-x1*pix+pointX2-pointX1, :]


    # 地図を作成する
    # 3857 球面メルカトル
    # 3395 回転楕円体メルカトル
    fig = plt.figure(figsize=(4,4))
    #plt.subplots_adjust(left=0, right=1, bottom=0, top=1)
    map = Basemap(epsg=3857,
            lat_ts=center_Lat, resolution='h',
            llcrnrlon=minLon, llcrnrlat=minLat,
            urcrnrlon=maxLon, urcrnrlat=maxLat)


    # 背景地図画像を描画
    mx0, my0 = map(minLon, minLat)
    mx1, my1 = map(maxLon, maxLat)

    extent = (mx0, mx1, my0, my1)
    plt.imshow(imgColors, vmin = 0, vmax = 255, extent = extent)


    # 経緯度線を描画
    map.drawparallels(np.arange(int(minLat), int(maxLat)+1, coordinateLineStep[z]), labels = [1,0,0,0], fontsize=8)
    map.drawmeridians(np.arange(int(minLon), int(maxLon)+1, coordinateLineStep[z]), labels = [0,0,0,1], fontsize=8)


    plt.savefig('1.jpg', dpi=72)
    plt.show()


# ズームレベルに応じた経緯度線のステップ
coordinateLineStep = {
    5 : 5.0,
    6 : 5.0,
    7 : 2.5,
    8 : 1.0,
    9 : 0.5,
   10 : 0.25,
   11 : 0.2,
   12 : 0.1,
   13 : 0.05,
   14 : 0.02,
   15 : 0.01,
   16 : 0.005,
   17 : 0.0025,
   18 : 0.002,
   19 : 0.002
}


if __name__ == '__main__':

    # 東京駅
    center_Lat = 35.681111
    center_Lon = 139.766667

    gap = 0.01
    minLat = center_Lat - gap
    minLon = center_Lon - gap * 1.2
    maxLat = center_Lat + gap
    maxLon = center_Lon + gap * 1.2

    print "北緯%f 東経%f - 北緯%f 東経%f" % (minLat, minLon, maxLat, maxLon)

    makeMap('Neighbourhood', center_Lat, center_Lon, minLat, minLon, maxLat, maxLon)
タイルサーバー一覧(tiles.hjson)
{
  "tiles": {
    // OpenStreetMap's Standard tile layer
    "OSMA"          : "https://a.tile.openstreetmap.org/{z}/{x}/{y}.png",
    "OSMB"          : "https://b.tile.openstreetmap.org/{z}/{x}/{y}.png",
    "OSMC"          : "https://c.tile.openstreetmap.org/{z}/{x}/{y}.png",

    // Wikimedia Maps
    "WikiMaps"      : "https://maps.wikimedia.org/osm-intl/{z}/{x}/{y}.png",

    // OpenCycleMap
    "OpenCycleMap"  : "https://tile.thunderforest.com/cycle/{z}/{x}/{y}.png?apikey=取得したAPIキー",

    // Transport
    "Transport"     : "https://tile.thunderforest.com/transport/{z}/{x}/{y}.png?apikey=取得したAPIキー",

    // Landscape
    "Landscape"     : "https://tile.thunderforest.com/landscape/{z}/{x}/{y}.png?apikey=取得したAPIキー",

    // Outdoors
    "Outdoors"      : "https://tile.thunderforest.com/outdoors/{z}/{x}/{y}.png?apikey=取得したAPIキー",

    // Transport Dark
    "TransportDark" : "https://tile.thunderforest.com/transport-dark/{z}/{x}/{y}.png?apikey=取得したAPIキー",

    // Spinal Map
    "SpinalMap"     : "https://tile.thunderforest.com/spinal-map/{z}/{x}/{y}.png?apikey=取得したAPIキー",

    // Pioneer
    "Pioneer"       : "https://tile.thunderforest.com/pioneer/{z}/{x}/{y}.png?apikey=取得したAPIキー",

    // Mobile Atlas
    "MobileAtlas"   : "https://tile.thunderforest.com/mobile-atlas/{z}/{x}/{y}.png?apikey=取得したAPIキー",

    // Neighbourhood
    "Neighbourhood" : "https://tile.thunderforest.com/neighbourhood/{z}/{x}/{y}.png?apikey=取得したAPIキー",

    // Humanitarian map style
    "HumanitarianMapA" : "http://a.tile.openstreetmap.fr/hot/{z}/{x}/{y}.png",

    // Hillshading
    "Hillshading"   : "http://c.tiles.wmflabs.org/hillshading/{z}/{x}/{y}.png",

    // Black & White map
    "toner"         : "http://a.tile.stamen.com/toner/{z}/{x}/{y}.png",

    // Terrain
    "Terrain"       : "http://a.tile.stamen.com/terrain/{z}/{x}/{y}.jpg",

    // Watercolor
    "Watercolor"    : "http://a.tile.stamen.com/watercolor/{z}/{x}/{y}.jpg",

    // Transport map
    "Transportmap"  : "http://www.openptmap.org/tiles/{z}/{x}/{y}.png",


    // 国土地理院
    // 電子国土基本図
    "std"           : "https://cyberjapandata.gsi.go.jp/xyz/std/{z}/{x}/{y}.png",

    // 土地利用図
    "lum200k"       : "https://cyberjapandata.gsi.go.jp/xyz/lum200k/{z}/{x}/{y}.png",

    // 全国最新写真(シームレス)
    "seamlessphoto" : "https://cyberjapandata.gsi.go.jp/xyz/seamlessphoto/{z}/{x}/{y}.jpg",

    // 色別標高図
    "relief"        : "https://cyberjapandata.gsi.go.jp/xyz/relief/{z}/{x}/{y}.png",

    // 陰影起伏図
    "hillshademap"  : "https://cyberjapandata.gsi.go.jp/xyz/hillshademap/{z}/{x}/{y}.png",

    // 傾斜量図
    "slopemap"      : "https://cyberjapandata.gsi.go.jp/xyz/slopemap/{z}/{x}/{y}.png",


    "toner" : "http://a.tile.stamen.com/toner/{z}/{x}/{y}.png",
  }
}