Python Basemapに陰影起伏図を描いてみる
前回、Python Basemapの背景地図として利用できそうな無料の地図タイルを調べていた際、
国土地理院の陰影起伏図ってどうたって描いてるんだろう(?)と調べてましたら、ArcGISさんに地形の高低情報から陰影起伏 (Hillshade) を計算するための計算式が載ってたので、
陰影起伏 (Hillshade) の仕組み—ヘルプ | ArcGIS Desktop
ちょっと真似して、国土地理院の標高タイル(数値標高モデル)データを使い、自前で陰影起伏図を描いてみました。
こんな感じ!
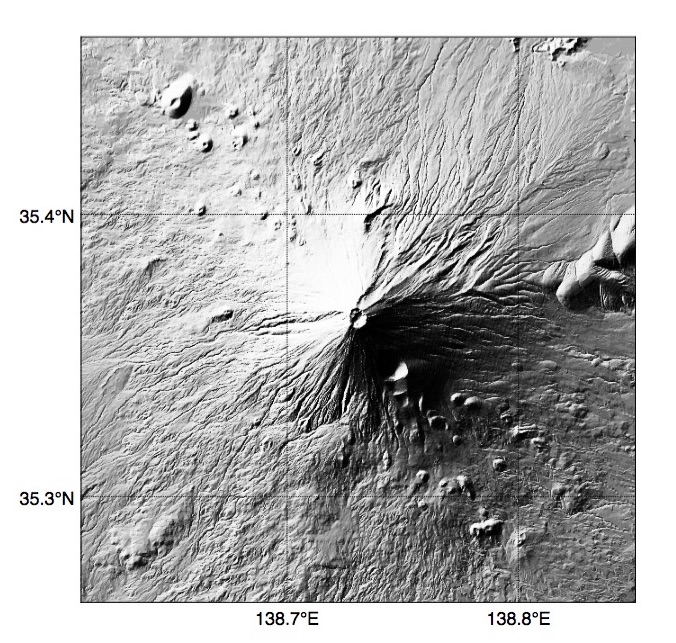
通常の陰影起伏図では、光源の方位角 315度(つまり北西方向)、光源の水平線からの高度45度で描画するのがどうも国土地理院の陰影起伏図でもデフォルトのようで、上はその方向から日の光が当たってる感じで地形の起伏を描いたものですが、
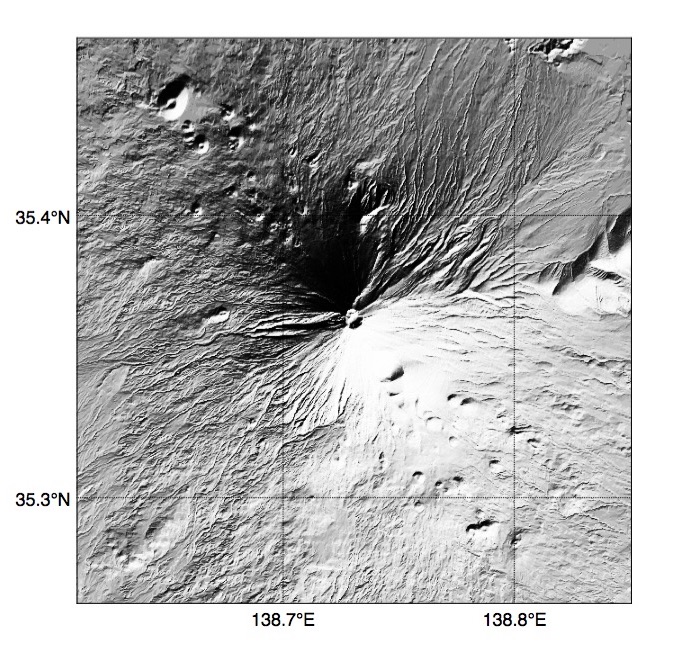
ちょっとまて! わたしゃ、お日様は南に昇ってないと嫌なんじゃ! ということで、お日様が南南東方向、方位角 150度、水平線から40度ぐらいで昇ってる感じで描いてみるとこんな感じになります。
陰影起伏 (Hillshade) を計算する関数は以下ような感じで、標高起伏データに、地形を照らす光源(太陽)の方位角と水平線からの高度、および作図する地図の中心点の緯度を与えてやると、陰影起伏 (Hillshade) のメッシュ配列返してよこします。
# 標高起伏データから陰影起伏 (Hillshade) を計算する
def hillshade(Z, center_Lat, azimuth_deg, altitude_deg):

    # 勾配(傾き)を求める
    Zx, Zy = np.gradient(Z)

    # 傾斜角
    Slope_rad = np.arctan(500 * Z_factor(center_Lat) * np.sqrt(Zx*Zx + Zy*Zy))

    # 傾斜方向
    Aspect_rad = np.arctan2(-Zx, Zy)

    # 太陽の方位角をラジアンに変換
    Azimuth_rad = np.radians(360.0 - azimuth_deg + 90)

    # 太陽の天頂角をラジアンに変換
    Zenith_rad = np.radians(90 - altitude_deg)

    # 陰影起伏
    shaded = np.cos(Zenith_rad) * np.cos(Slope_rad) + np.sin(Zenith_rad) * np.sin(Slope_rad) * np.cos(Azimuth_rad - Aspect_rad)
    return 255 * shaded
で!
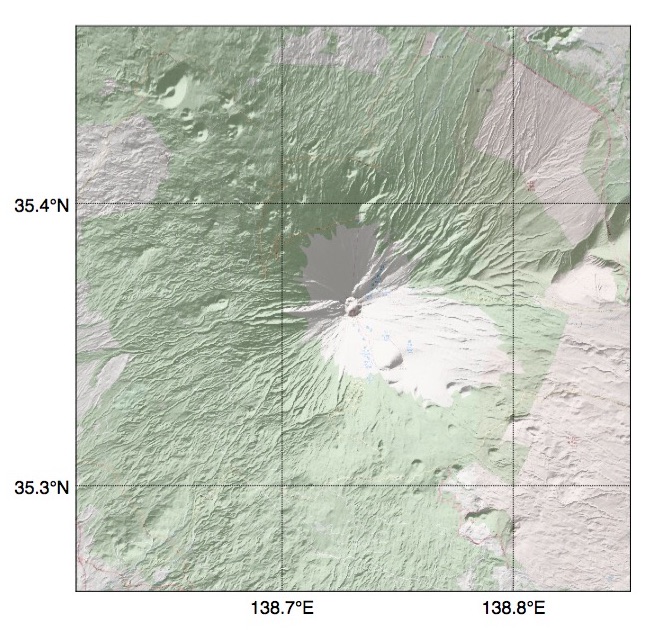
陰影起伏図にOpenStreetMapの地図画像をオーバーレイしてみたのが以下で、
斜面勾配図ぽいものを先日重ねて描いてみた時より立体感が出てきますね。
全体のソースはこんな感じになりました。
import requests
from StringIO import StringIO
import string
import pandas as pd
import numpy as np
import hjson

import matplotlib.pyplot as plt
import matplotlib.colors as colors
from matplotlib import cm

from scipy import misc

from mpl_toolkits.basemap import Basemap
from osgeo import gdal

from math import pi
from math import tanh
from math import sin
from math import cos
from math import asin
from math import exp
from numpy import arctanh

from pyproj import Geod


# 1タイルのピクセル数
pix = 256

# 描画に使用する縦横の最小タイル数
Tiles = 3

g = Geod(ellps='WGS84')


# ピクセル座標を経緯度に変換する
def fromPointToLatLng(pixelLat,pixelLon, z):
    L = 85.05112878
    lon = 180 * ((pixelLon / 2.0**(z+7) ) - 1)
    lat = 180/pi * (asin(tanh(-pi/2**(z+7)*pixelLat + arctanh(sin(pi/180*L)))))
    return lat, lon


# 経緯度をピクセル座標に変換する
def fromLatLngToPoint(lat,lon, z):
    L = 85.05112878
    pointX = int( (2**(z+7)) * ((lon/180) + 1) )
    pointY = int( (2**(z+7)/pi) * (-1 * arctanh(sin(lat * pi/180)) + arctanh(sin(L * pi/180))) )
    return pointX, pointY


# 経緯度をタイル座標に変換する
def fromLatLngToTile(lat,lon, z):
    pointX, pointY = fromLatLngToPoint(lat,lon, z)
    return pointX/pix, pointY/pix


# 指定経緯度範囲が異なるタイルにまたがる最小のズームレベルとそのタイル座標を返す
def getTile(Tiles, minLat, minLon, maxLat, maxLon):

    for z in range(0,20):
        tileX1, tileY1 = fromLatLngToTile(minLat, minLon, z)
        tileX2, tileY2 = fromLatLngToTile(maxLat, maxLon, z)

        if tileX2 - tileX1 >= Tiles - 1  and tileY1 - tileY2 >= Tiles - 1: break

    return z, tileX1, tileY1, tileX2, tileY2


# 指定緯度帯のZ係数を返す
def Z_factor(lat):

    zfactors = {
             0 : 0.00000898,
            10 : 0.00000912,
            20 : 0.00000956,
            30 : 0.00001036,
            40 : 0.00001171,
            50 : 0.00001395,
            60 : 0.00001792,
            70 : 0.00002619,
            80 : 0.00005156
        }

    return zfactors[np.trunc(lat/10.0)*10.0]


# 地形データを読み込む
def load_gis(urlFormat, z, x1, y1, x2, y2):

    for x in range(x1, x2+1):
        for y in range(y2, y1+1):

            #地形データを読み込む
            url = urlFormat.format(z=z,x=x,y=y)
            print url
            response = requests.get(url)
            if response.status_code == 404:
                 Z = np.zeros((256, 256))
            else:
                 #標高値がない区画はとりあえず0mに置換する
                 maptxt = string.replace(response.text, u'e', u'0.0')
                 Z = pd.read_csv(StringIO(maptxt), header=None)
                 Z = Z.values

            # 標高タイルを縦に連結
            if y == y2:
                 gis_v = Z
            else:
                 #gis_v = cv2.vconcat([gis_v, Z])
                 gis_v = np.append(gis_v,Z,0)
                 #gis_v = np.concatenate((gis_v, Z), axis = 0) #縦

        # 標高タイルを横に連結
        if x == x1:
            gis = gis_v
        else:
            #gis = cv2.hconcat([gis, gis_v])
            #gis = np.append(gis,gis_v,1)
            gis = np.concatenate((gis,gis_v), axis = 1) #横

    return gis


# 地図画像データを読み込み各ピクセルをRGB値に変換した配列を返す
def load_imgColors(urlFormat, z, x1, y1, x2, y2):

    for x in range(x1, x2+1):
        for y in range(y2, y1+1):

            #地図画像データを読み込む
            url = urlFormat.format(z=z,x=x,y=y)
            print url
            response = requests.get(url)
            if response.status_code == 404:

                 #地図画像データが無い区画は白塗りにする
                 colors=np.ones((256, 256, 3), dtype=object)

            else:

                 #画像READ
                 img = misc.imread(StringIO(response.content))

            # 画像タイルを縦に連結
            if y == y2:
                 im_v = img
            else:
                 #im_v = cv2.vconcat([im_v, img])
                 #im_v = np.append(im_v,img,0)
                 im_v = np.concatenate((im_v, img), axis = 0) #縦

        # 画像タイルを横に連結
        if x == x1:
            im = im_v
        else:
            #im = cv2.hconcat([im, im_v])
            #im = np.append(im,im_v,1)
            im = np.concatenate((im,im_v), axis = 1) #横

    return im


# 標高タイルから陰影起伏 (Hillshade) を計算する
def hillshade(Z, center_Lat, azimuth_deg, altitude_deg):

    # 通常の陰影起伏図は、光源方位 315 度、光源方位 45 度で描画
    #
    # 陰影起伏 = 255.0 * ((cos(Zenith_rad) * cos(Slope_rad)) +
    #                 (sin(Zenith_rad) * sin(Slope_rad) * cos(Azimuth_rad - Aspect_rad)))


    # 勾配(傾き)を求める
    Zy, Zx = np.gradient(Z)

    # 傾斜角
    Slope_rad = np.arctan(500 * Z_factor(center_Lat) * np.sqrt(Zx*Zx + Zy*Zy))

    # 傾斜方向
    Aspect_rad = np.arctan2(-Zx, Zy)

    # 太陽の方位角をラジアンに変換
    Azimuth_rad = np.radians(360.0 - azimuth_deg + 90)

    # 太陽の天頂角をラジアンに変換
    Zenith_rad = np.radians(90 - altitude_deg)

    # 陰影起伏
    shaded = np.cos(Zenith_rad) * np.cos(Slope_rad) + np.sin(Zenith_rad) * np.sin(Slope_rad) * np.cos(Azimuth_rad - Aspect_rad)
    return 255 * shaded


# 画像を平坦化する
def imgFlattening(img):

    # 画像のヒストグラムを平坦化する
    # ヒストグラムを取得
    hist, bins = np.histogram( img.flatten(), bins=256 )

    # 累積分布を取る
    cdf = hist.cumsum()

    # 0〜255の範囲に正規化
    cdf = 255 * cdf / cdf[-1]

    # ヒストグラムが平坦化するよう線形補間
    img2 = np.interp( img.flatten(), bins[:-1], cdf)

    return img2.reshape( img.shape )


def makeMap(center_Lat, center_Lon, minLat, minLon, maxLat, maxLon):

    # 指定経緯度範囲の最適ズームとタイル座標範囲を求める
    z, x1, y1, x2, y2  = getTile(Tiles, minLat, minLon, maxLat, maxLon)


    # タイルURL
    f=open('tiles.hjson')
    tiles = hjson.load(f)
    f.close()


    # OpenStreetMapのタイル画像を読み込み連結して1枚の画像として返す
    imgColors = load_imgColors(tiles['tiles']['OSMA'], z, x1, y1, x2, y2)

    # 標高タイルのURLフォーマット
    urlFormat = 'http://cyberjapandata.gsi.go.jp/xyz/dem/{z}/{x}/{y}.txt'

    # 標高タイルを読み込み連結して1枚の標高タイルとして返す
    Z = load_gis(urlFormat, z, x1, y1, x2, y2)


    # 標高タイルから陰影起伏を計算する
    Zshade = hillshade(Z, center_Lat, 150, 40)

    # 陰影起伏を0..1に正規化
    Zshade_norm = (Zshade-Zshade.min())/(Zshade.max()-Zshade.min())

    # 陰影起伏をグレイスケール画像にする
    projectionIMG = cm.binary(Zshade_norm)*255

    # 透過情報はカット
    projectionIMG = projectionIMG[:,:,:3]

    # 陰影起伏図の画像を平坦化して明度のバランスを整える
    projectionIMG = imgFlattening(projectionIMG)


    # 地図画像と射影印影図を足して2で割りゃ画像が合成される
    imgColors = (imgColors + projectionIMG) / 2


    # ガンマ補正
    #gamma = 1.2
    #imax = imgColors.max()
    #imgColors = imax * (imgColors / imax)**(1/gamma)


    imgColors = np.uint8(imgColors)


    # 指定経緯度のピクセル座標を求める
    pointX1, pointY1 = fromLatLngToPoint(minLat, minLon, z)
    pointX2, pointY2 = fromLatLngToPoint(maxLat, maxLon, z)


    # 経緯度範囲に地図タイルをカット
    imgColors = imgColors[pointY2-y2*pix:pointY2-y2*pix+pointY1-pointY2, pointX1-x1*pix:pointX1-x1*pix+pointX2-pointX1, :]
    projectionIMG = projectionIMG[pointY2-y2*pix:pointY2-y2*pix+pointY1-pointY2, pointX1-x1*pix:pointX1-x1*pix+pointX2-pointX1, :]


    # 地図を作成する
    # 3857 球面メルカトル
    # 3395 回転楕円体メルカトル
    fig = plt.figure(figsize=(12,9.8))
    map = Basemap(epsg=3395,
            lat_ts=center_Lat, resolution='h',
            llcrnrlon=minLon, llcrnrlat=minLat,
            urcrnrlon=maxLon, urcrnrlat=maxLat)


    # 背景地図画像を描画
    mx0, my0 = map(minLon, minLat)
    mx1, my1 = map(maxLon, maxLat)

    extent = (mx0, mx1, my0, my1)
    plt.imshow(imgColors, vmin = 100, vmax = 255, extent = extent)


    # 海岸線を描画
    map.drawcoastlines( linewidth=1.0, color='k' )

    # 経緯度線を描画
    map.drawparallels(np.arange(int(minLat), int(maxLat)+1, coordinateLineStep[z]), labels = [1,0,0,0], fontsize=18)
    map.drawmeridians(np.arange(int(minLon), int(maxLon)+1, coordinateLineStep[z]), labels = [0,0,0,1], fontsize=18)

    plt.savefig('1.jpg', dpi=72)
    plt.show()


# ズームレベルに応じた経緯度線のステップ
coordinateLineStep = {
    3 : 5.0,
    4 : 5.0,
    5 : 5.0,
    6 : 5.0,
    7 : 2.5,
    8 : 1.0,
    9 : 0.5,
   10 : 0.5,
   11 : 0.25,
   12 : 0.25,
   13 : 0.1,
   14 : 0.1,
   15 : 0.05,
   16 : 0.05,
   17 : 0.025,
   18 : 0.025,
   19 : 0.002
}


if __name__ == '__main__':

    # 富士山
    center_Lat = 35.3625
    center_Lon = 138.7306

    gap = 0.1

    minLat = center_Lat - gap
    minLon = center_Lon - gap * 1.2
    maxLat = center_Lat + gap
    maxLon = center_Lon + gap * 1.2

    print "北緯%f 東経%f - 北緯%f 東経%f" % (minLat, minLon, maxLat, maxLon)

    makeMap(center_Lat, center_Lon, minLat, minLon, maxLat, maxLon)
陰影起伏 (Hillshade)—ヘルプ | ArcGIS Desktop