matplotlibとMayaviでNASAの画像を『地球儀』にしてみた。
前回、地球の全体地図をPythonで描いてましたら

むむ!
地球の全体図を球面にマッピングすれば地球儀が描けるじゃん!と思い至り
NASAが公開している、経緯度の間隔が方眼紙と同じ等間隔の直行平面上に単純にマッピングされた正距円筒図法(plate carrée)「blue marble」のイメージを使い今回はPythonで『地球儀』を描いてみることに。
NASA Visible Earth: December, Blue Marble Next Generation w/ Topography and Bathymetry
使用したデーターは、縦横5400x2700の「blue marble」のイメージ

それで、半径rの球面の球面座標 (r,θ,φ) から直交直線座標 (x,y,z) への変換は

以下で求まりますので、
球面座標 θ、φの範囲0 ≤ θ ≤ π、0 ≤ φ < 2πからx、y、zの取りうる範囲を求め、求めたx、y、zから3Dで球面を描き、その表面をNASAの「blue marble」イメージで塗りつぶして、『地球儀』をmatplotlibを使い描いてみると、こんな感んじ!
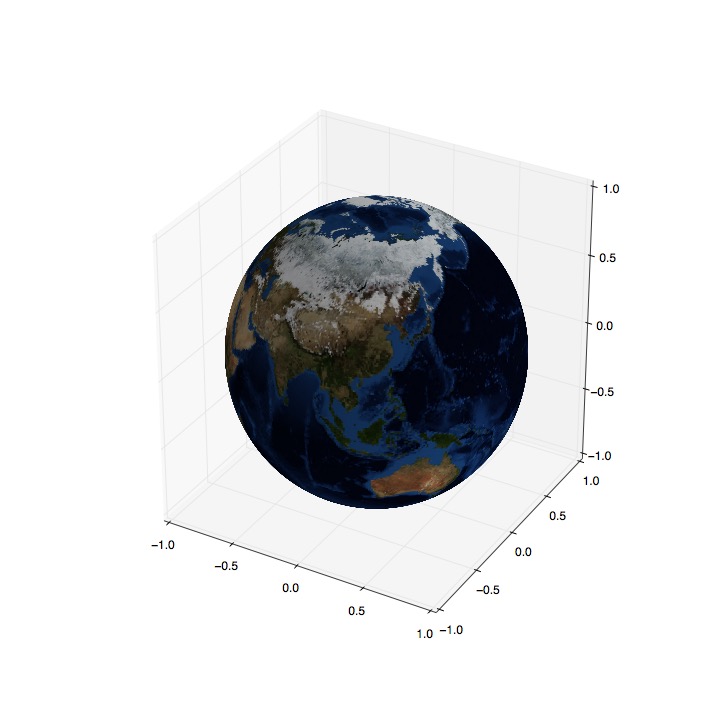
ソースは、以下ですが
import matplotlib.pyplot as plt
import numpy as np
from mpl_toolkits.mplot3d import Axes3D

def sphere_plot(image_file):

    img = plt.imread(image_file)

    # 画像を少し間引く
    img=img[::10,::10]


    # 球の球面座標 r:動径、θ:極角(天頂角)、φ:方位角(偏角)
    R = 1
    theta = np.linspace(0, np.pi, img.shape[0])
    phi = np.linspace(0, 2*np.pi, img.shape[1])

    # 球の球面座標 (r,θ,φ) を直交直線座標 (x,y,z) に変換
    x = R * np.outer(np.cos(phi), np.sin(theta))
    y = R * np.outer(np.sin(phi), np.sin(theta))
    z = R * np.outer(np.ones(np.size(phi)), np.cos(theta))


    # 球の表面をイメージファイルで塗りつぶして3Dで描画する
    fig = plt.figure(figsize=(10, 10))
    ax = fig.add_subplot(111, projection='3d')
    plt.subplots_adjust(left=0, right=1, bottom=0, top=1)

    ax.plot_surface(x.T, y.T, z.T, rstride=1, cstride=1, facecolors = img/256.)

    plt.savefig('1.jpg', dpi=72)
    plt.show()


if __name__ == "__main__":

    # 5400x2700
    image_file = 'world.topo.bathy.200412.3x5400x2700.jpg'
    sphere_plot(image_file)
matplotlibだとめちゃんこ時間がかかります。
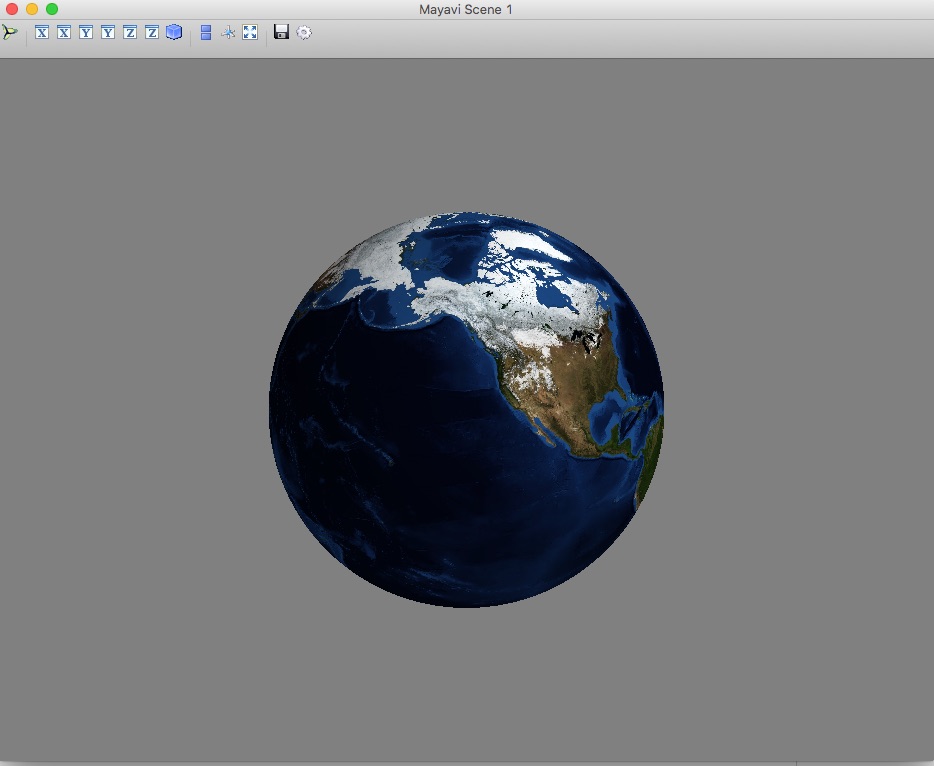
ということで、3Dグラフィックスのための強力なテクスチャマッピングとレンダリングエンジン ( VTK )を搭載した対話的3次元プロットパッケージMayaviで『地球儀』を描いてみるとこんな感じ!
Mayavi: 3D scientific data visualization and plotting in Python — mayavi 4.6.2 documentation
速い! 速い!
matplotlibの1000倍は早いかもと思えるような超高速の一瞬で『地球儀』を表示してきました。
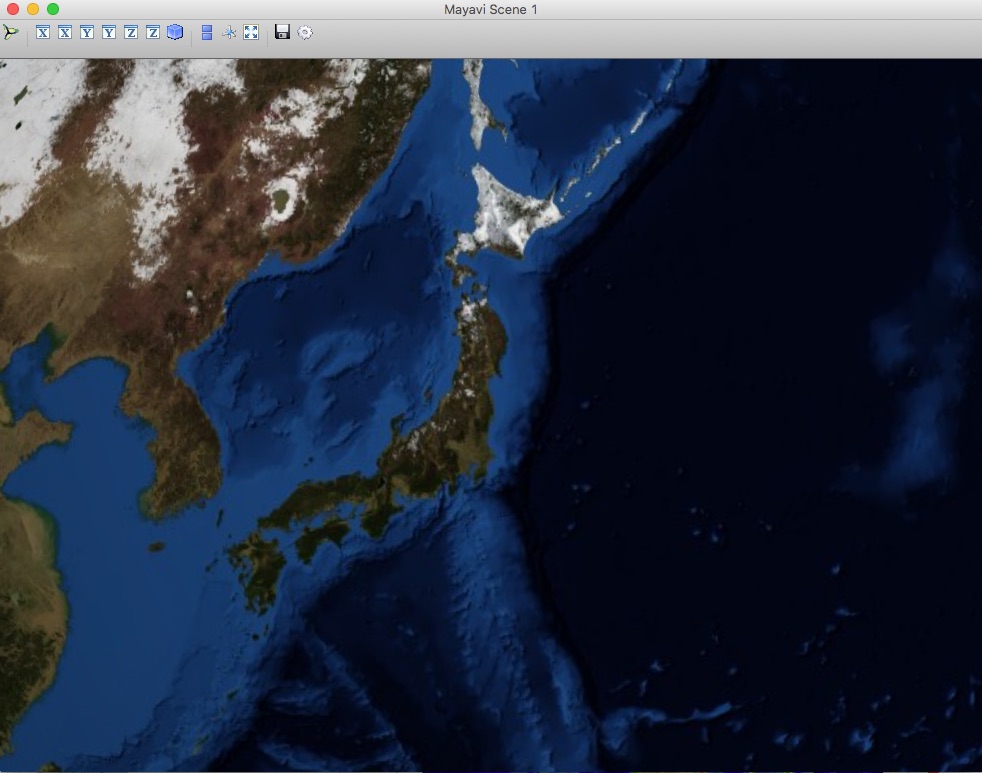
ズーマップも思いのまま

ソースは、以下
from mayavi import mlab
from tvtk.api import tvtk

def sphere_plot(image_file):

    # 図形ウィンドウをジェネレート
    fig = mlab.figure(size=(800, 800))

    # マップ画像をテクスチャにロードする
    img = tvtk.JPEGReader()
    img.file_name = image_file
    texture = tvtk.Texture(input_connection=img.output_port, interpolate=1)


    R = 1 # 球の半径
    Nrad = 1000 # テクスチャの分割数

    # テクスチャをマッピングする半径Rの球面を生成
    sphere = tvtk.TexturedSphereSource(radius=R, theta_resolution=Nrad,
                                       phi_resolution=Nrad)

    # 図形ウィンドウにテクスチャのマッパーとアクターを紐づける
    sphere_mapper = tvtk.PolyDataMapper(input_connection=sphere.output_port)
    sphere_actor = tvtk.Actor(mapper=sphere_mapper, texture=texture)
    fig.scene.add_actor(sphere_actor)

    mlab.show()


if __name__ == "__main__":

    # 5400x2700
    image_file = 'world.topo.bathy.200412.3x5400x2700.jpg'
    sphere_plot(image_file)
同じ方法で月球儀や火星義、木星義に土星義、小惑星義なんてのも簡単に描けそうですね。