陰影段彩図を返す地図タイルサーバーを立ち上げてみる。
前回、ETOPO1グローバル地形データセットで地球全体の陰影段彩図を作成してみましたが、
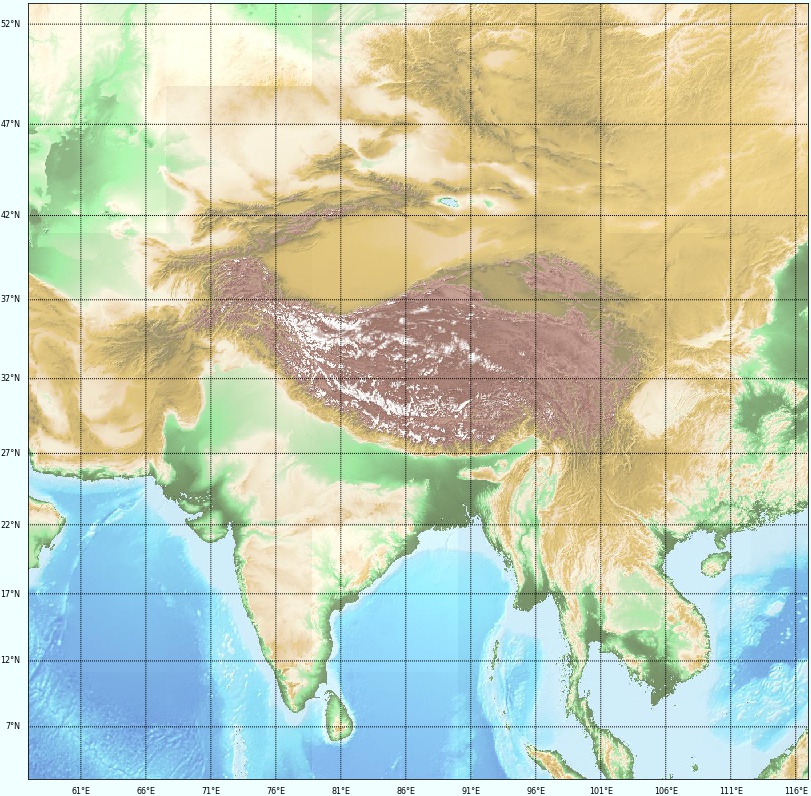
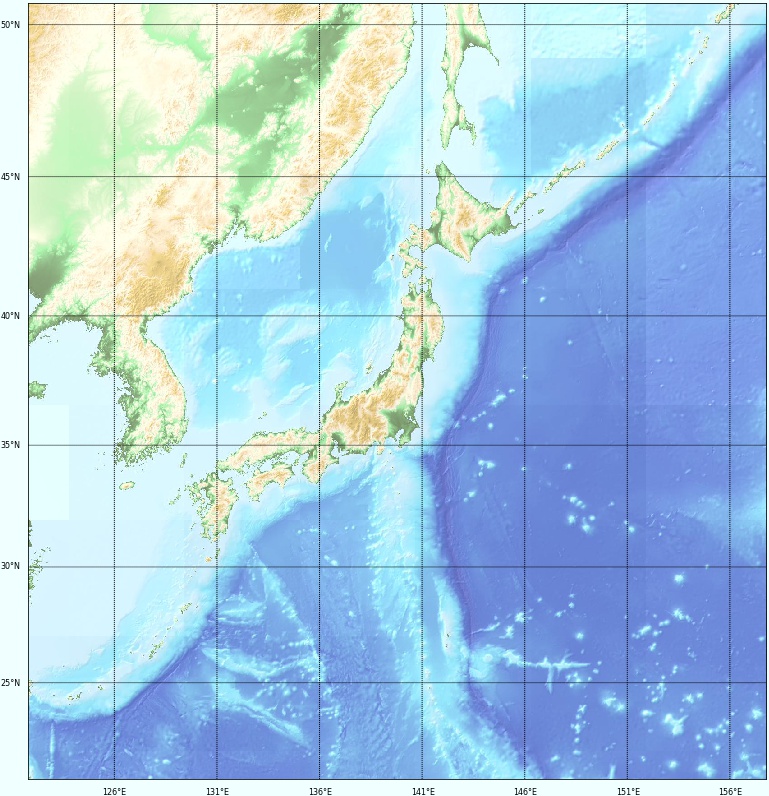
今回は、ETOPO1から作成した地球全体の陰影段彩図をズームレベル1〜10までのタイル画像としてデーターベス化し、そのデーターを元に自前の地図タイルサーバーを立ち上げ、以下のよう地図を描いてみることに。
地形データから作成した陰影段彩図を地図タイル化するのは、それほど難しくはないので、まず、以下スクリプトで
1.ズームレベル1〜10までの地図タイル画像をデータベースに登録
地図タイル画像は単にファイルとして書き出してもいいのですが、地図タイルはズームレベルが上がるにつれ、地球全体をカバーしようとするとタイル数が数億を超える膨大な数のタイルになり、あっという間に、ディスクに書き込み可能なファイル数(inode数)を食いつぶしてしまうので、
今回は、JPEG形式で作成した地図タイル画像をMySQLのデーターベースにつこんでみることに。なお、生のバイナリーをSQL文に記述するのはちょっと厄介なので、今回は作成したJPEG形式のタイル画像を、電子メールに画像を添付する際に使われているbase64にエンコードしてからMySQLにつこんでみることに。
ソースは以下
#!/usr/bin/env python
# -*- coding: utf-8 -*-

import numpy as np
from netCDF4 import Dataset

import MySQLdb
import StringIO
import string

from math import pi
from math import tanh
from math import sin
from math import asin
from numpy import arctanh
from scipy import interpolate

import matplotlib.colors as colors
from matplotlib import cm
from sklearn import preprocessing

from PIL import Image
import base64

e_db_host = "localhost"
e_db_port = 3306
e_db = "earthquake"
e_db_user = "user"
e_db_passwd = "passwd"


# ピクセル座標を緯度経度に変換する
def fromPointToLatLng(pixelLat,pixelLon, z):
    L = 85.05112878
    lon = 180 * ((pixelLon / 2.0**(z+7) ) - 1)
    lat = 180/pi * (asin(tanh(-pi/2**(z+7)*pixelLat + arctanh(sin(pi/180*L)))))
    return lat, lon

# 経緯度のピクセル座標を求める
def fromLatLngToPoint(lat,lon, z):
    L = 85.05112878
    pointX = int( (2**(z+7)) * ((lon/180) + 1) )
    pointY = int( (2**(z+7)/pi) * (-1 * arctanh(sin(lat * pi/180)) + arctanh(sin(L * pi/180))) )
    return pointX, pointY


# 経緯度の世界座標を求める
def fromLatLngToWordLatLon(lat, lon, z):
    L = 85.05112878
    wordLon = (2**(z+7)) * ((lon/180) + 1)
    wordLat = (2**(z+7)/pi) * (-1. * arctanh(sin(lat * pi/180)) + arctanh(sin(L * pi/180)))
    return wordLat, wordLon


def makecolormap():

    # 基点となる標高での色を配列として定義する
    color = np.array([[-12000, 'darkblue'],
                 [-6000, '#0938BF'],
                 [-2500,  '#50D9FB'],
                 [-1,     '#B7E5FA'],
                 [0,      '#1F4806'],
                 [100,    '#68E36B'],
                 [150,    '#98D685'],
                 [300,    '#F9EFCD'],
                 [800,    '#E0BB7D'],
                 [1000,   '#D3A62D'],
                 [2500,   '#997618'],
                 [3000,   '#705B10'],
                 [3500,   '#5F510D'],
                 [4000,   '#A56453'],
                 [5000,   '#5C1D09'],
                 [5500,   'snow'],
                 [12000,  'white']])


    # 標高値を0..1の範囲に正規化
    hight = color[:, 0].astype(np.float32)
    hightnorm = preprocessing.minmax_scale(hight)


    # 正規化した標高値と各色の組みのリストcolornormを生成
    colornorm = []
    for no, norm in enumerate(hightnorm):
        colornorm.append([norm, color[no, 1]])

    # colornormに従いグラデーションカラーマップを作成
    cmap = colors.LinearSegmentedColormap.from_list('a', colornorm, N=hight.max()-hight.min()+1)


    # カラーマップを割り当てる1m間隔の標高値
    hightbounds = range(int(hight.min()), int(hight.max()+1))

    return cmap, hightbounds

# 標高値から陰影起伏 (Hillshade) を計算する
def hillshade(Z, center_Lat, azimuth_deg, altitude_deg):

    # 通常の陰影起伏図は、光源方位 315 度、光源方位 45 度で描画
    #
    # 陰影起伏 = 255.0 * ((cos(Zenith_rad) * cos(Slope_rad)) +
    #                 (sin(Zenith_rad) * sin(Slope_rad) * cos(Azimuth_rad - Aspect_rad)))

    # 勾配(傾き)を求める
    Zy, Zx = np.gradient(Z)

    # 傾斜角
    Slope_rad = np.arctan(0.001 * np.sqrt(Zx*Zx + Zy*Zy))

    # 傾斜方向
    Aspect_rad = np.arctan2(-Zx, Zy)

    # 太陽の方位角をラジアンに変換
    Azimuth_rad = np.radians(360.0 - azimuth_deg + 90)

    # 太陽の天頂角をラジアンに変換
    Zenith_rad = np.radians(90 - altitude_deg)

    # 陰影起伏
    shaded = np.cos(Zenith_rad) * np.cos(Slope_rad) + np.sin(Zenith_rad) * np.sin(Slope_rad) * np.cos(Azimuth_rad - Aspect_rad)
    return 255 * shaded


etopo1 = Dataset('ETOPO1_Ice_g_gmt4.grd','r')

lons   = etopo1.variables['x'][:]
lats   = etopo1.variables['y'][:]
depths = etopo1.variables['z'][:]


# 1タイルのピクセル数
pix = 256

# -12000m〜12000mまでのカラーグラデーションを作成する
cmap, hightbounds = makecolormap()

conn = MySQLdb.connect(db=e_db, host=e_db_host, port=e_db_port, user=e_db_user, passwd=e_db_passwd)
cursor = conn.cursor()

for z in range(0, 11):

    print z

    # 縦横のタイル分割数
    partition = 2**z


    # 標高タイルを出力する
    for row in range(partition):
        for column in range(partition):

            # タイル描画な経度範囲を求める
            lat1, lon1 = fromPointToLatLng(pix * row, pix * column, z)
            lat2, lon2 = fromPointToLatLng(pix * (row+1), pix * (column+1), z)

            print z, row, column, lat1, lon1, lat2, lon2

            condLats = (lats >= lat2-1) * (lats <= lat1+1)
            condLons = (lons >= lon1-1) * (lons <= lon2+1)

            # 経度条件を満たす配列インデックスを抽出
            latsIX = np.array(np.where(condLats)).flatten()
            lonsIX = np.array(np.where(condLons)).flatten()

            # 経緯度条件を満たす経緯度と標高データを取り出す
            X = lons[lonsIX].flatten()
            Y = lats[latsIX].flatten()
            Z = depths[latsIX[0]:latsIX[-1]+1, lonsIX[0]:lonsIX[-1]+1]

            # 地図タイルは経度は北から南への座標なので経度方向は逆順にする
            Y = Y[::-1]
            Z = Z[::-1, :]


            # 経緯度を世界座標に変換する
            WordLats = np.array([fromLatLngToWordLatLon(lat,0, z)[0] for lat in Y])
            WordLons = np.array([fromLatLngToWordLatLon(0,lon, z)[1] for lon in X])

            # 拡張したい経度方向、緯度方向の座標を生成
            # 補完後の座標がピクセル座標ピッタリになるよう間隔は1づつの整数値になるようにする
            pointX = np.linspace(column*pix, pix+column*pix-1, pix)
            pointY = np.linspace(row*pix, pix+row*pix-1, pix)


            # 標高データを経度方向に線形補間しながら拡張または縮小する
            for y in range(Z.shape[0]):
                depthsX = Z[y,:]
                linearf = interpolate.interp1d(WordLons, depthsX, kind='linear', fill_value='extrapolate')

                # 縦に連結
                depthsLinear = [linearf(pointX)]
                if y == 0:
                    depthsExtendX = depthsLinear
                else:
                    depthsExtendX = np.concatenate((depthsExtendX, depthsLinear), axis = 0) #縦

            # 標高データを緯度方向に線形補間しながら拡張または縮小する
            for x in range(depthsExtendX.shape[1]):
                depthsY = depthsExtendX[:,x]
                linearf = interpolate.interp1d(WordLats, depthsY, kind='linear', fill_value='extrapolate')

                # 横に連結
                depthsLinear = np.array([linearf(pointY)]).T  # 結果は1行n列からn行1列に転置しておく
                if x == 0:
                    depthsExtend = depthsLinear
                else:
                    depthsExtend = np.concatenate((depthsExtend, depthsLinear), axis = 1) #横


            # 標高・水深に応じたカラーイメージ配列を生成する
            # カラーグラデーションの+12000が0mに対応するので標高値は+12000する
            img =cmap(np.uint16(depthsExtend)+12000)

            # 透過情報はカット
            img=img[:,:,:3]

            img*=255

            # 標高値から陰影起伏を計算する
            Zshade = hillshade(depthsExtend, 0, 315, 60)

            # 陰影起伏を0..0.5に正規化
            Zshade_norm = (Zshade-Zshade.min())/(Zshade.max()-Zshade.min())
            Zshade_norm/=2

            # 陰影起伏をグレイスケール画像にする
            projectionIMG = cm.binary(Zshade_norm)*255

            # 透過情報はカット
            projectionIMG = projectionIMG[:,:,:3]

            # 高度段彩図と射影印影図を足して2で割りゃ画像が合成される
            img = (img + projectionIMG) / 2.0

            img = img*1.2 #輝度値を約2倍上げる
            img = img + 10 #輝度値のベースを25上げる
            img = np.minimum(img,255)


            # imgをPILイメージに変換
            pil_img = Image.fromarray(img.astype(np.uint8))

            # PILイメージをJPGに変換し画像ファイルの生データを読み出す
            buf= StringIO.StringIO()
            pil_img.save(buf, format="jpeg")
            pict = buf.getvalue()
            buf.close()

            sql = '''insert into relief_%02d set
                                     x = %d,
                                     y = %d,
                                     pict = '%s'
                                 ''' \
                                 % (
                                     z,
                                     column,
                                     row,
                                     base64.b64encode(pict)
                                  )

            cursor.execute( sql )


cursor.close()
conn.close()
2.陰影段彩図を返す地図タイルサーバーを立ち上げ
次に、上で作成した地図タイルを直接データベースから読み込んで地図を作成してもいいのですが、タイルサーバー化すると何かと便利なので、pythonでちょっとしたHTTPをしたい時に簡単にHTTPサーバーを立ち上げられるwsgiref.simple_serverで
http://localhost:8000/relief/3/4/2.jpg
のようなアドレスでアクセスすると以下のようなタイルを返す簡易地図タイルサーバーを作成。

ソースは以下で
本格的なサーバーを動かしたい時はApache経由でPythonのWSGI アプリを動かす方がいいのですが、wsgiref.simple_server機能を使うと以下のようにわずか数行でHTTPサーバーアプリが立ち上げられます。
ちなみに本格的にApache経由でPythonのWSGI アプリを動かすと、サーバーの回線性能次第ですが、最近のVPSサーバーなら、ユニークKEYのデータを単にDBから読み込んで返すだけなら、マシン的には1秒間に数100〜1000回ぐらいのアクセスには耐えれます。
(なお、ソースを簡単にするためエラー処理などは一切組み込んでいません。)
#!/usr/bin/env python
# -*- coding: utf-8 -*-

from wsgiref.simple_server import make_server
import MySQLdb
import base64
import re


e_db_host = "localhost"
e_db_port = 3306
e_db = "earthquake"
e_db_user = "user"
e_db_passwd = "passwd"


def application(environ, start_response):

    # アクセスパスから取得タイルを決定
    PATH_INFO = environ.get('PATH_INFO')

    m=re.search('relief/(\d+)/(\d+)/(\d+).jpg', PATH_INFO)
    if m:
        z = int(m.group(1))
        x = int(m.group(2))
        y = int(m.group(3))


    # 陰影段彩図を読み込む
    conn = MySQLdb.connect(db=e_db, host=e_db_host, port=e_db_port, user=e_db_user, passwd=e_db_passwd)
    cursor = conn.cursor()
    sql = "select * from relief_%02d where x=%d and y=%d" % (z, x, y)
    cnt = cursor.execute( sql )
    rec = cursor.fetchone()
    cursor.close()
    conn.close()

    # base64でエンコードされている陰影段彩図をデコードする
    tile = base64.b64decode(rec[2])

    start_response('200 OK', [('Content-Type', 'image/jpeg')])
    return tile


httpd = make_server('', 8000, application)
print("Serving on port 8000...")

httpd.serve_forever()
あとは、先日、無料地図タイルサーバーから地図を作成してみたときの要領で
3.タイルサーバーから地図画像を取得し地図を作成
タイルサーバー一覧(tiles.hjson)に以下を追加し
    // my server
    // 陰影段彩図
    "myrelief"           : "http://localhost:8000/relief/{z}/{x}/{y}.jpg",
ソースは以下
#!/usr/bin/env python
# -*- coding: utf-8 -*-

import requests
from StringIO import StringIO
import string
import pandas as pd
import numpy as np
import hjson

import matplotlib.pyplot as plt
import matplotlib.colors as colors
from matplotlib import cm

from scipy import misc

from mpl_toolkits.basemap import Basemap
from osgeo import gdal

from math import pi
from math import tanh
from math import sin
from math import asin
from math import exp
from numpy import arctanh

from pyproj import Geod


# 1タイルのピクセル数
pix = 256

# 描画に使用する縦横の最小タイル数
Tiles = 6

g = Geod(ellps='WGS84')


# ピクセル座標を経緯度に変換する
def fromPointToLatLng(pixelLat,pixelLon, z):
    L = 85.05112878
    lon = 180 * ((pixelLon / 2.0**(z+7) ) - 1)
    lat = 180/pi * (asin(tanh(-pi/2**(z+7)*pixelLat + arctanh(sin(pi/180*L)))))
    return lat, lon


# 経緯度をピクセル座標に変換する
def fromLatLngToPoint(lat,lon, z):
    L = 85.05112878
    pointX = int( (2**(z+7)) * ((lon/180) + 1) )
    pointY = int( (2**(z+7)/pi) * (-1 * arctanh(sin(lat * pi/180)) + arctanh(sin(L * pi/180))) )
    return pointX, pointY


# 経緯度をタイル座標に変換する
def fromLatLngToTile(lat,lon, z):
    pointX, pointY = fromLatLngToPoint(lat,lon, z)
    return pointX/pix, pointY/pix


# 指定経緯度範囲が異なるタイルにまたがる最小のズームレベルとそのタイル座標を返す
def getTile(Tiles, minLat, minLon, maxLat, maxLon):

    for z in range(0,20):
        tileX1, tileY1 = fromLatLngToTile(minLat, minLon, z)
        tileX2, tileY2 = fromLatLngToTile(maxLat, maxLon, z)

        if tileX2 - tileX1 >= Tiles - 1  and tileY1 - tileY2 >= Tiles - 1: break

    return z, tileX1, tileY1, tileX2, tileY2


# 地図画像データを読み込み各ピクセルをRGB値に変換した配列を返す
def load_imgColors(urlFormat, z, x1, y1, x2, y2):

    for x in range(x1, x2+1):
        for y in range(y2, y1+1):

            #地図画像データを読み込む
            url = urlFormat.format(z=z,x=x,y=y)
            print url
            response = requests.get(url)
            if response.status_code == 404:

                 #地図画像データが無い区画は白塗りにする
                 colors=np.ones((256, 256, 3), dtype=object)

            else:

                 #画像READ
                 img = misc.imread(StringIO(response.content))

            # 画像タイルを縦に連結
            if y == y2:
                 im_v = img
            else:
                 #im_v = cv2.vconcat([im_v, img])
                 #im_v = np.append(im_v,img,0)
                 im_v = np.concatenate((im_v, img), axis = 0) #縦

        # 画像タイルを横に連結
        if x == x1:
            im = im_v
        else:
            #im = cv2.hconcat([im, im_v])
            #im = np.append(im,im_v,1)
            im = np.concatenate((im,im_v), axis = 1) #横

    return im


def makeMap(tileServer, center_Lat, center_Lon, minLat, minLon, maxLat, maxLon):

    # 指定経緯度範囲の最適ズームとタイル座標範囲を求める
    z, x1, y1, x2, y2  = getTile(Tiles, minLat, minLon, maxLat, maxLon)

    # タイルURL
    f=open('tiles.hjson')
    tiles = hjson.load(f)
    f.close()


    # 陰影段彩図のタイル画像のURLフォーマット
    urlFormat = tiles['tiles'][tileServer]
    print urlFormat

    # 陰影段彩図のタイル画像を読み込み連結して1枚の画像として返す
    imgColors = load_imgColors(urlFormat, z, x1, y1, x2, y2)


    # 指定経緯度のピクセル座標を求める
    pointX1, pointY1 = fromLatLngToPoint(minLat, minLon, z)
    pointX2, pointY2 = fromLatLngToPoint(maxLat, maxLon, z)


    # 経緯度範囲に地図タイルをカット
    imgColors = imgColors[pointY2-y2*pix:pointY2-y2*pix+pointY1-pointY2, pointX1-x1*pix:pointX1-x1*pix+pointX2-pointX1, :]


    # 地図を作成する
    # 3857 球面メルカトル
    # 3395 回転楕円体メルカトル
    fig = plt.figure(figsize=(14,14))
    #plt.subplots_adjust(left=0, right=1, bottom=0, top=1)
    map = Basemap(epsg=3857,
            lat_ts=center_Lat, resolution='h',
            llcrnrlon=minLon, llcrnrlat=minLat,
            urcrnrlon=maxLon, urcrnrlat=maxLat)


    # 背景地図画像を描画
    mx0, my0 = map(minLon, minLat)
    mx1, my1 = map(maxLon, maxLat)

    extent = (mx0, mx1, my0, my1)
    plt.imshow(imgColors, vmin = 0, vmax = 255, extent = extent)


    # 経緯度線を描画
    map.drawparallels(np.arange(int(minLat), int(maxLat)+1, coordinateLineStep[z]), labels = [1,0,0,0], fontsize=8)
    map.drawmeridians(np.arange(int(minLon), int(maxLon)+1, coordinateLineStep[z]), labels = [0,0,0,1], fontsize=8)


    #plt.savefig('2.jpg', dpi=72)
    plt.savefig('2.jpg', dpi=72, facecolor="azure", bbox_inches='tight', pad_inches=0)
    plt.show()

# ズームレベルに応じた経緯度線のステップ
coordinateLineStep = {
    5 : 5.0,
    6 : 5.0,
    7 : 2.5,
    8 : 1.0,
    9 : 0.5,
   10 : 0.25,
   11 : 0.2,
   12 : 0.1,
   13 : 0.05,
   14 : 0.02,
   15 : 0.01,
   16 : 0.005,
   17 : 0.0025,
   18 : 0.002,
   19 : 0.002
}


if __name__ == '__main__':


    # 東京駅
    center_Lat = 35.681111
    center_Lon = 139.766667


    # エベレスト
    center_Lat = 27.988056
    center_Lon = 86.925278


    gap = 25.0
    minLat = center_Lat - gap
    minLon = center_Lon - gap * 1.2
    maxLat = center_Lat + gap
    maxLon = center_Lon + gap * 1.2

    print "北緯%f 東経%f - 北緯%f 東経%f" % (minLat, minLon, maxLat, maxLon)

    makeMap('myrelief', center_Lat, center_Lon, minLat, minLon, maxLat, maxLon)